I’ve been curious about the possibilities of building Tableau dashboards with AI, so I decided to give the newly released Tableau Data Apps a try!
What particularly interested me was the opportunity to build on an existing Tableau environment. For organizations that have already invested in Tableau data sources, governance, and infrastructure, could AI provide a faster way to create new dashboard experiences without starting from scratch?
Using Codex with the Tableau MCP Server integration, I experimented with building interactive dashboards connected to a published Tableau data source and publishing the results to Tableau Cloud.
I wanted to test two different scenarios:
- Recreating an existing dashboard using a screenshot and a published Tableau data source.
- Building a brand-new dashboard using the same data source, but without a wireframe or detailed design instructions.
The results were impressive, and I learned a few things along the way that I thought would be worth sharing.
Experiment 1: Recreating an Existing Dashboard
For my first experiment, I decided to start with something familiar: a Help Desk Dashboard I’d previously built in Tableau.
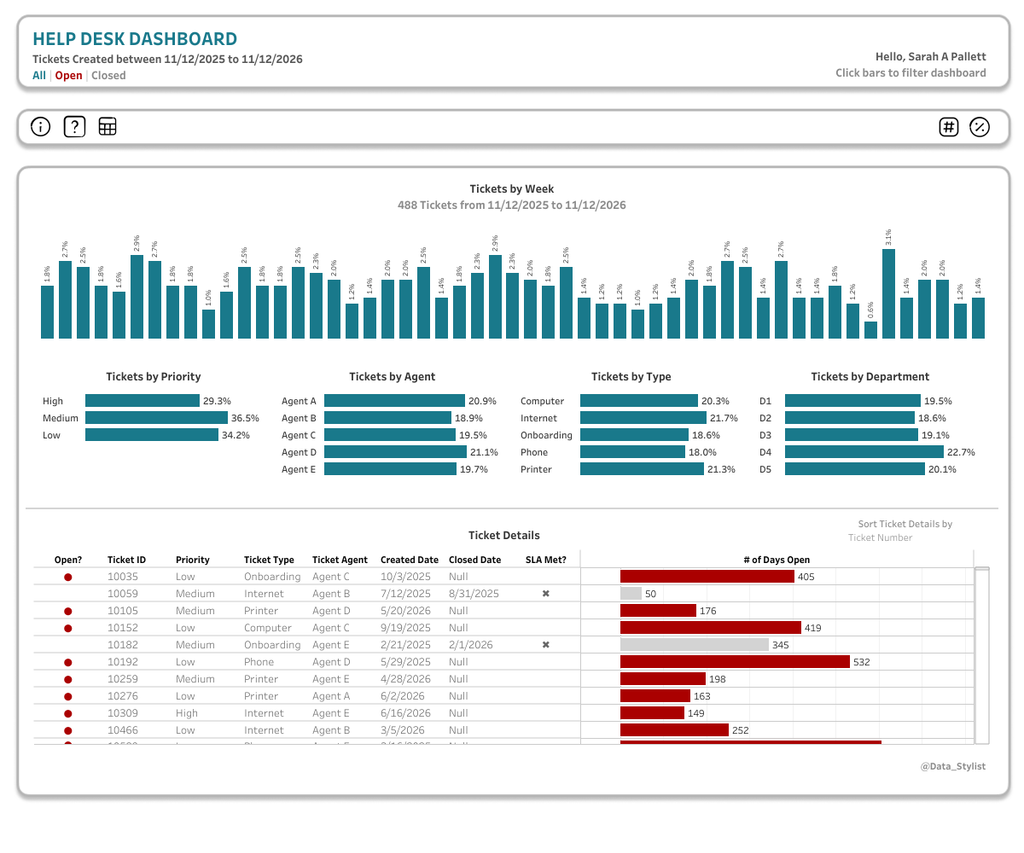
This wasn’t a simple dashboard. It included multiple charts, interactive filtering, toggles, a detailed table, and several other features. I thought it would be a good test of what AI could accomplish.
I gave Codex two things:
- A screenshot of my existing dashboard.
- A link to the published Tableau data source on Tableau Cloud.
Then I asked it to recreate the dashboard using Tableau Data Apps.
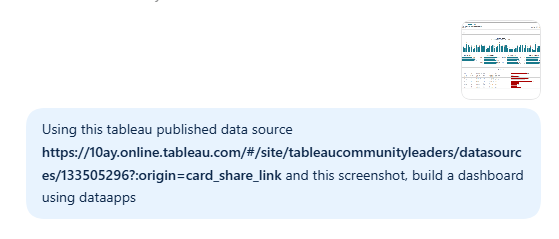
I also specifically asked Codex to show me a draft before publishing anything to Tableau Cloud.
And off it went!
The First Draft
Codex generated an interactive draft that I could review directly in my browser.
This wasn’t simply a static image of a dashboard. It was a functioning web page with interactive charts, filters, toggles, and a sortable detail table.
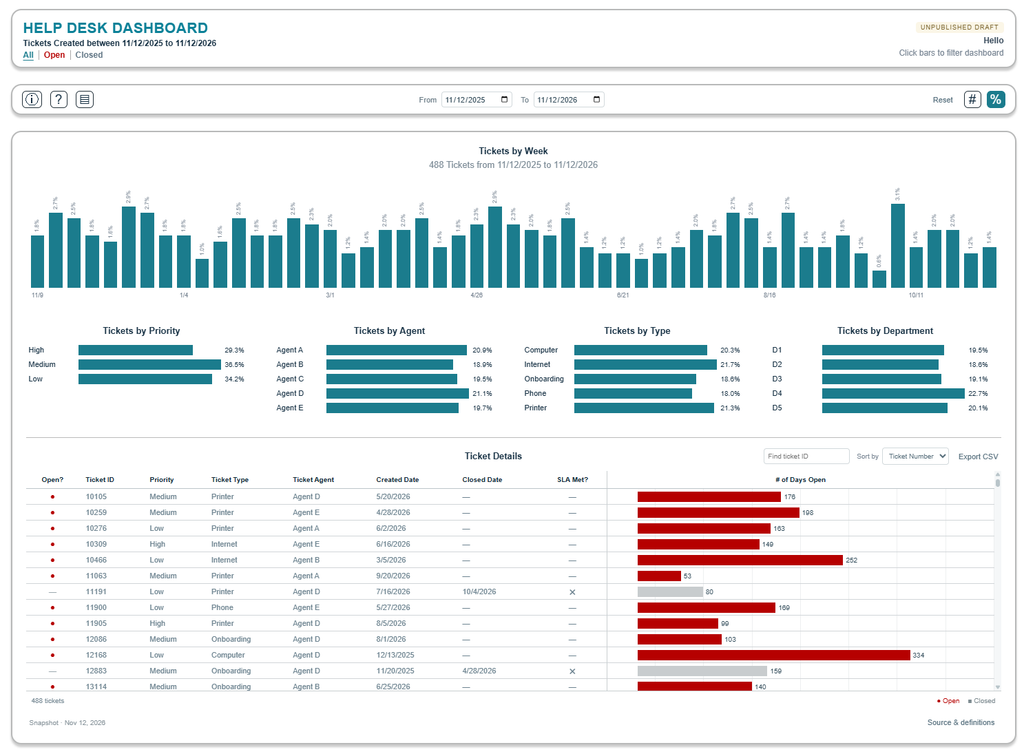
I was impressed by how closely it recreated the original design, especially considering that I had only provided a screenshot and the data source.
After reviewing the draft, I asked Codex to publish the dashboard to Tableau Cloud.
What Worked and What Needed Adjusting?
The overall result was excellent, but there were a few interesting differences between the AI-generated version and my original dashboard.
1. The username was hardcoded.
The original screenshot displayed my name in the dashboard header. Codex initially treated that as static text rather than recognizing that it should be dynamic.
I needed to provide additional instructions to have it display the name of the current Tableau Cloud user.
2. It misunderstood one of the icons.
My original dashboard included an icon to show or hide the calendar controls. Codex interpreted that icon as a control for showing or hiding the table instead.
Not a major issue, but here’s an important distinction between Tableau Data Apps and traditional Tableau workbooks: You can’t simply open the dashboard in Tableau Desktop and make the change yourself.
Instead, you need to provide a new prompt to the AI tool explaining what you want to change. The AI then updates the Data App based on your instructions.
It’s a different approach to dashboard development, and something to keep in mind if you’re accustomed to having direct control over every element of your Tableau dashboards.
3. It added some functionality of its own!
This was a pleasant surprise.
Codex made the All, Open, and Closed labels in the dashboard subtitle clickable, allowing users to filter the dashboard directly from the header.
It also added a Reset button, which was a nice touch.
These weren’t features I specifically requested, but they were thoughtful additions to the user experience.
My Takeaway from Experiment 1
Two things stood out to me: the speed and the quality of the output.
But there’s an important consideration here.
The inputs I provided were already highly refined. The published data source was ready to use, and the screenshot represented a polished dashboard that I’d spent considerable time designing and developing.
In other words, a lot of the thinking had already been done.
The data model, metric definitions, layout, and dashboard functionality were established before Codex ever started building.
That made me curious.
What would happen if I gave AI much less direction?
Experiment 2: Building a Brand-New Dashboard
For my second experiment, I decided to take a different approach.
This time, I wanted to see what Codex would create without an existing dashboard to reference.
I provided:
- The same published Tableau data source.
- A color palette with primary, secondary, and accent colors.
That’s it!
No screenshot. No wireframe. No detailed dashboard layout.
A Few Questions Before Getting Started
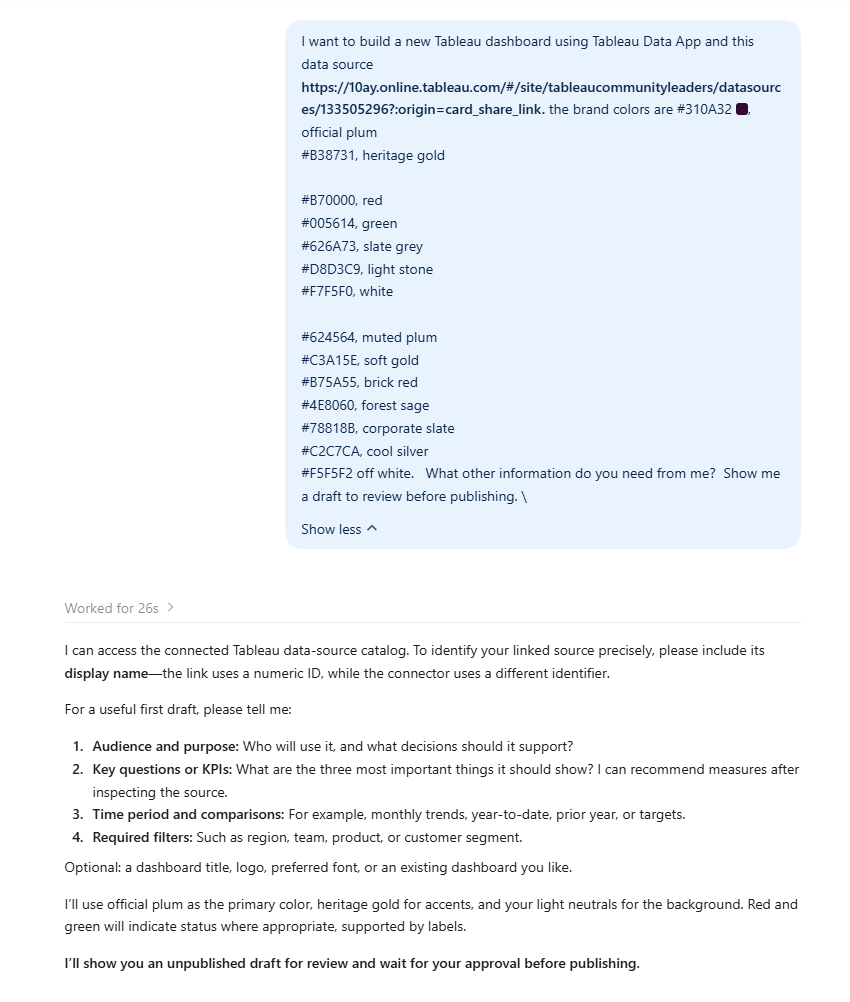
Rather than immediately generating a dashboard, Codex asked me a few questions.
It wanted to know:
- Audience and purpose: Who would use the dashboard, and what decisions should it support?
- Key metrics: What were the most important questions or KPIs to display?
- Time period: What date ranges or comparisons should be included?
- Filters: Which dimensions should users be able to filter by?
It also asked for clarification about the published data source.
I liked this part of the experience. Instead of making all the decisions on its own, it asked for additional context to guide the build.
Once I answered the questions, it got to work.
The Result
Codex generated a completely new Help Desk Dashboard using the data source and branding guidelines I’d provided.
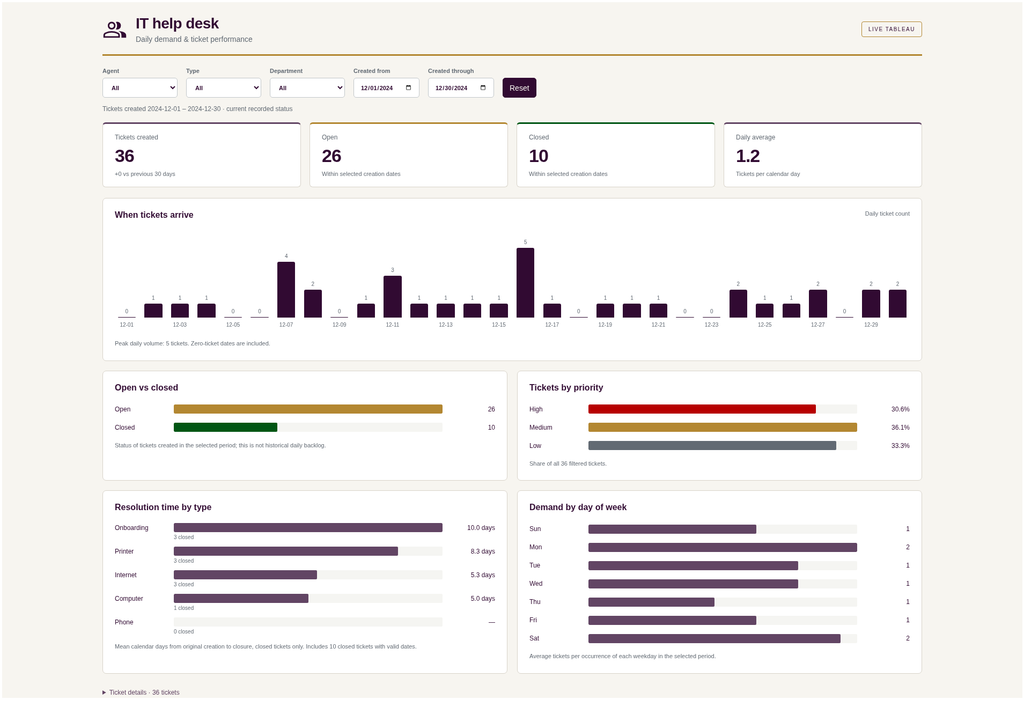
The result included KPI cards, trend charts, breakdowns by priority and ticket type, and interactive filters.
The visual design was quite different from my original dashboard, which was exactly what I wanted to test.
And just like the first experiment, I could review the draft as a fully interactive web page before asking Codex to publish it to Tableau Cloud.
One small thing worth noting: the Download Image option captured what was visible in the browser window rather than exporting the entire dashboard.
Not a dealbreaker, but something to be aware of.
My Takeaway from Experiment 2
This experiment was especially interesting because I hadn’t provided a detailed design.
Codex made decisions about the dashboard layout, chart selection, and visual hierarchy based on the data and the requirements we discussed.
It was a great demonstration of how AI can help accelerate the early stages of dashboard development.
Of course, I’d still want to review the metric calculations, validate the data, and make sure the dashboard supports the intended business questions before rolling it out to users.
But as a starting point? Very impressive!
Why Build Data Apps with Tableau?
Beyond the speed of dashboard development, there are some compelling reasons to build AI-powered data applications using your existing Tableau environment.
1. Leverage your existing data governance
Rather than starting from scratch with a new data connection, you can work with published Tableau data sources and the governance framework already established in your organization.
2. Keep your dashboards connected to current data
Because the dashboards use Tableau data sources, they can reflect updated data as the underlying live connections or extracts are refreshed.
3. Keep everything in one place
Publishing your Data Apps to Tableau Cloud or Tableau Server means they can live alongside your other analytics content, rather than introducing another disconnected reporting tool.
For organizations that have already invested in Tableau, this is an exciting opportunity to extend the value of their existing analytics environment.
What Do You Need to Get Started?
If you’re interested in experimenting with Tableau Data Apps, here’s what I’d recommend having ready:
- An AI tool: I used Codex for my experiments.
- A Tableau Cloud environment: With access to the published data source you want to use.
- The Tableau MCP Server integration: Connected to your AI tool.
- A trusted published data source: Ideally one that’s already been validated and certified.
- Dashboard requirements: At least a general understanding of the audience, metrics, and business questions.
- Brand guidelines: A color palette, fonts, and design template can help create a consistent look and feel.
And if you already have an existing dashboard or wireframe, try providing a screenshot as a starting point.
Based on my experience, the quality of the inputs can make a big difference in the quality of the results.
Want to Learn More?
If you’d like to dive deeper into Tableau Data Apps, I recommend following Steve Adams, Kirk Munroe, and Just Tim. They’ve been posting incredible content for the DataFam and offer fantastic insights into this space!
Looking for official documentation? Start here on Tableau’s website: https://www.tableau.com/blog/what-are-tableau-data-apps
Final Thoughts
I came away from these experiments genuinely impressed by what I was able to accomplish with Tableau Data Apps and AI.
The speed was remarkable, and the ability to move from a prompt to a functioning, interactive dashboard was exciting to see.
But what excites me most isn’t simply how quickly AI can build a dashboard. It’s the opportunity to build on the data sources, governance, and infrastructure organizations have already invested in.
Rather than starting from scratch, we can use AI to create new experiences with the Tableau data we already know and trust.
And while AI can dramatically accelerate the building process, the fundamentals of good dashboard development still matter. A well-designed data model, clearly defined metrics, thoughtful requirements, and an understanding of your audience all contribute to a successful dashboard.
There’s still an important role for the person guiding the work, validating the results, and making sure the dashboard delivers meaningful insights.
I’m looking forward to experimenting more with Tableau Data Apps and seeing how these capabilities continue to evolve.
Happy Vizzing!