Make your text tables on dashboards shine with an easy, interactive, custom sort order feature.
The concept is simple: give your dashboard viewers a handy-dandy drop-down menu so they can sort their table with the rows of most importance to them at the top. I deployed this technique on my Help Desk Dashboard – click here to see it in action.
Begin by building your text table and determining the various ways in which the table can be sorted. For my Help Desk Dashboard, I chose Ticket Priority, # of Days Open, and Ticket Number. I also wanted to be sure the table always defaulted to show the rows by Ticket Number when the workbook is opened. Once you’ve established these values, you can create a calculation to set the default value and a parameter with the list of sort options.
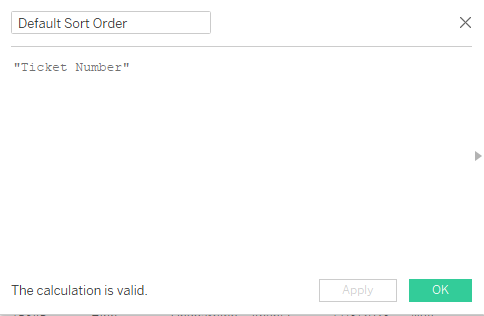

Note the Default Sort Order calculation appears in the “Value when workbook opens” spot in the parameter.
Once the parameter is created, you can show the parameter and take a sneak peak at the appearance of the toggle.
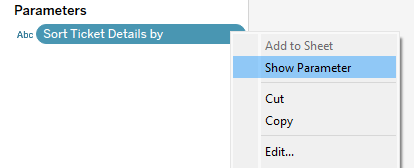
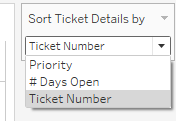
Looks good! We are now ready for our next step, which requires us to use this parameter in a calculation. A CASE statement works beautifully in this step.
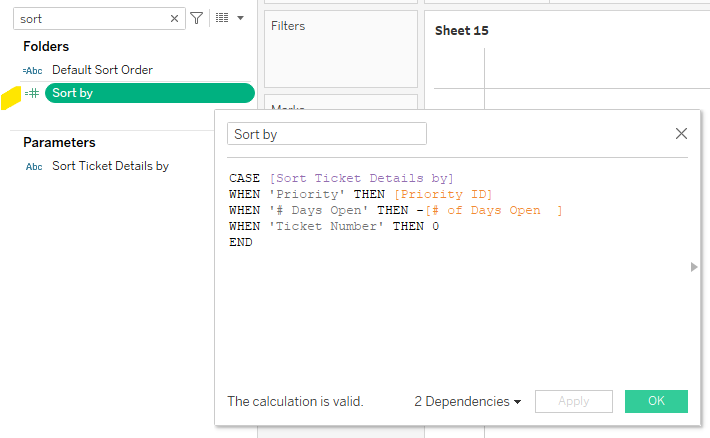
With this calculation, we are asking Tableau to do the following:
When the toggle is set to Priority, Tableau will check the Priority ID and sort by this value. For your reference, the Priority ID in this dataset assigns High Priority the value of 20, Medium is 30, and Low is 40. For the rows to be listed from High to Low, we will want to use this calculation in Ascending Order: 20-30-40 (Tuck away that thought for later!)
When the toggle is set to # of Days Open, we want Tableau to reference a calculation by the same name that counts the difference in days between Created Date and Closed Date, or in the case of tickets still open, the difference between Created Date and Today. Now, recall that we will be using this calculation in Ascending Order per the note above regarding Priority. This means we must place a negative sign in front of # of Days Open in order for the tickets with the longest # of days open to appear at the top. For example, if a ticket has been opened for 35 days, it will appear above a ticket that has only been opened for 2 days if we assign it a negative value (ascending order is -35 then -2).
And last but not least, when the toggle is set to Ticket Number, we want Tableau to return a 0. Why? We built our text table with Ticket Number as the first value on the Rows shelf, so Tableau will use this value to sort the orders because our Sort Order calculation assigns a 0 to all rows in this setting.

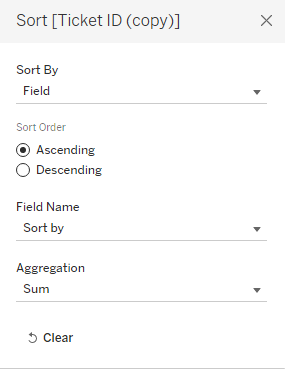
Last but not least, we need to activate this calculation by accessing the drop-down from the Ticket Number field on the rows shelf > Sort and follow the prompts to select the Sort Order field and Ascending order.

So there you have it – with a couple of calculations and one parameter, you can add interactivity to your text table and give the dashboard viewer the control to see the rows of data in the order most relevant to them!
Feel free to download my viz on Tableau Public and take a look under the hood!
Happy Vizzing!
Leave a Reply